| Using the Zoom Box |
| Using the Scaling Toolbar |
| Using the Axis Scroll Bars |
| Rescaling Using the Mouse Wheel |
The Scaling functions allow you to change the limit points, analysis range, and axis scaling when working in the Graph tab. You can zoom in or out on a specific area of the graph and set specific limits and options. For instructions on defining a data range, refer to Defining a Data Range TRIOS Help topic.
To use the TRIOS scaling functions:
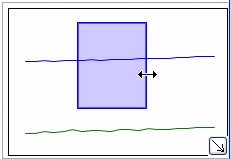
To enlarge a particular portion of the curve for analysis, follow these steps:
You can zoom in repeatedly to expand a smaller portion of the curve. (Alternatively, the Zoom window can be used to perform further rescaling.)
After drawing the zoom box, right-click within the dotted lines to display the Zoom Box pop-up menu, which contains the following items:
After you select an option from the menu, the graph will be rescaled and a Zoom window is displayed in the lower right corner (default position).
Once the graph is rescaled, the Zoom window displays in the lower-right corner of the Graph view. Click here to display an example.
The following rescale functions can also be performed in this window.
 .
. .
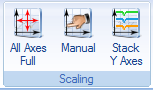
.The Scaling toolbar on the Format tab contains commonly-used plot scaling functions. These functions are also available on the pop-up menu that displays when you right-click within the plot.
See Also
Using the Graph View
To restore the selected axis to optimum scale settings and view the whole curve in the plot window, right-click the axis and select Full scale axis. The graph is automatically scaled to the minimum and maximum data values for the selected axis only.
To restore all of the axes on your graph to their optimum scale settings, select Scaling toolbar > Full Scale All . The graph is automatically scaled to the minimum and maximum data values for all of the axes contained in the file.
If you wish to set specific scaling limits for your plot and choose properties such as scaling type (linear, log, or absolute) and other options, select Scaling toolbar > Manual ![]() . For detailed information, see Manually Rescaling a Graph.
. For detailed information, see Manually Rescaling a Graph.
To access Exact Scaling X and Exact Scaling Y, right-click the plot (not the curve) and select Zooming.
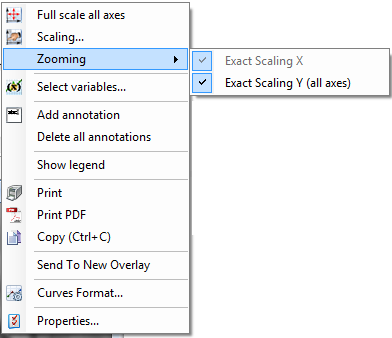
To plot the axis using the exact range of the x-coordinates found in the data file or rescale zoom box, select Exact Scaling X. Leave this menu item checked and the data will be automatically scaled when applicable. When exact scaling is not selected, the plot axis is drawn with evenly-spaced axis labels that fall on the corners of the plot. This is the default setting.
To plot the axis using the exact range of the y-coordinates found in the data file or rescale zoom box, select Exact Scaling Y. Leave this menu item checked and the data will be automatically scaled when applicable. When exact scaling is not selected, the plot axis is drawn with evenly spaced axis labels that fall on the corners of the plot. This is the default setting.
Select Stack Y Axis![]() from the Scaling toolbar to adjust the y-axis so that the curves on the axes are stacked, one above the other, with no curves from one axis overlapping the curves of another axis.
from the Scaling toolbar to adjust the y-axis so that the curves on the axes are stacked, one above the other, with no curves from one axis overlapping the curves of another axis.
The Graph View has controls that can be used to quickly adjust the plot limits for the plotted axes on the fly. Each axis has three types of controls—scroll buttons, inside scroll bar, and outside scroll bar.
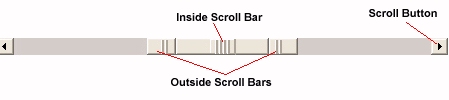
To use the scroll bars:
The mouse wheel may also be used to zoom in or out on an area (adjusting both the magnitude of the x and y scaling). To use this feature, click on the desired axis then use the mouse wheel to scroll up or down.
A zoom box automatically opens when zooming with the mouse wheel (if one is not already displayed). This feature may be used with a zoom box already opened and visible, but is not available when the zoom box is closed.
